- Only 2.1% of U.S. homeowners with a mortgage were underwater as of Q4 2021
- Borrowers gained over $3.2 trillion in equity in 2021
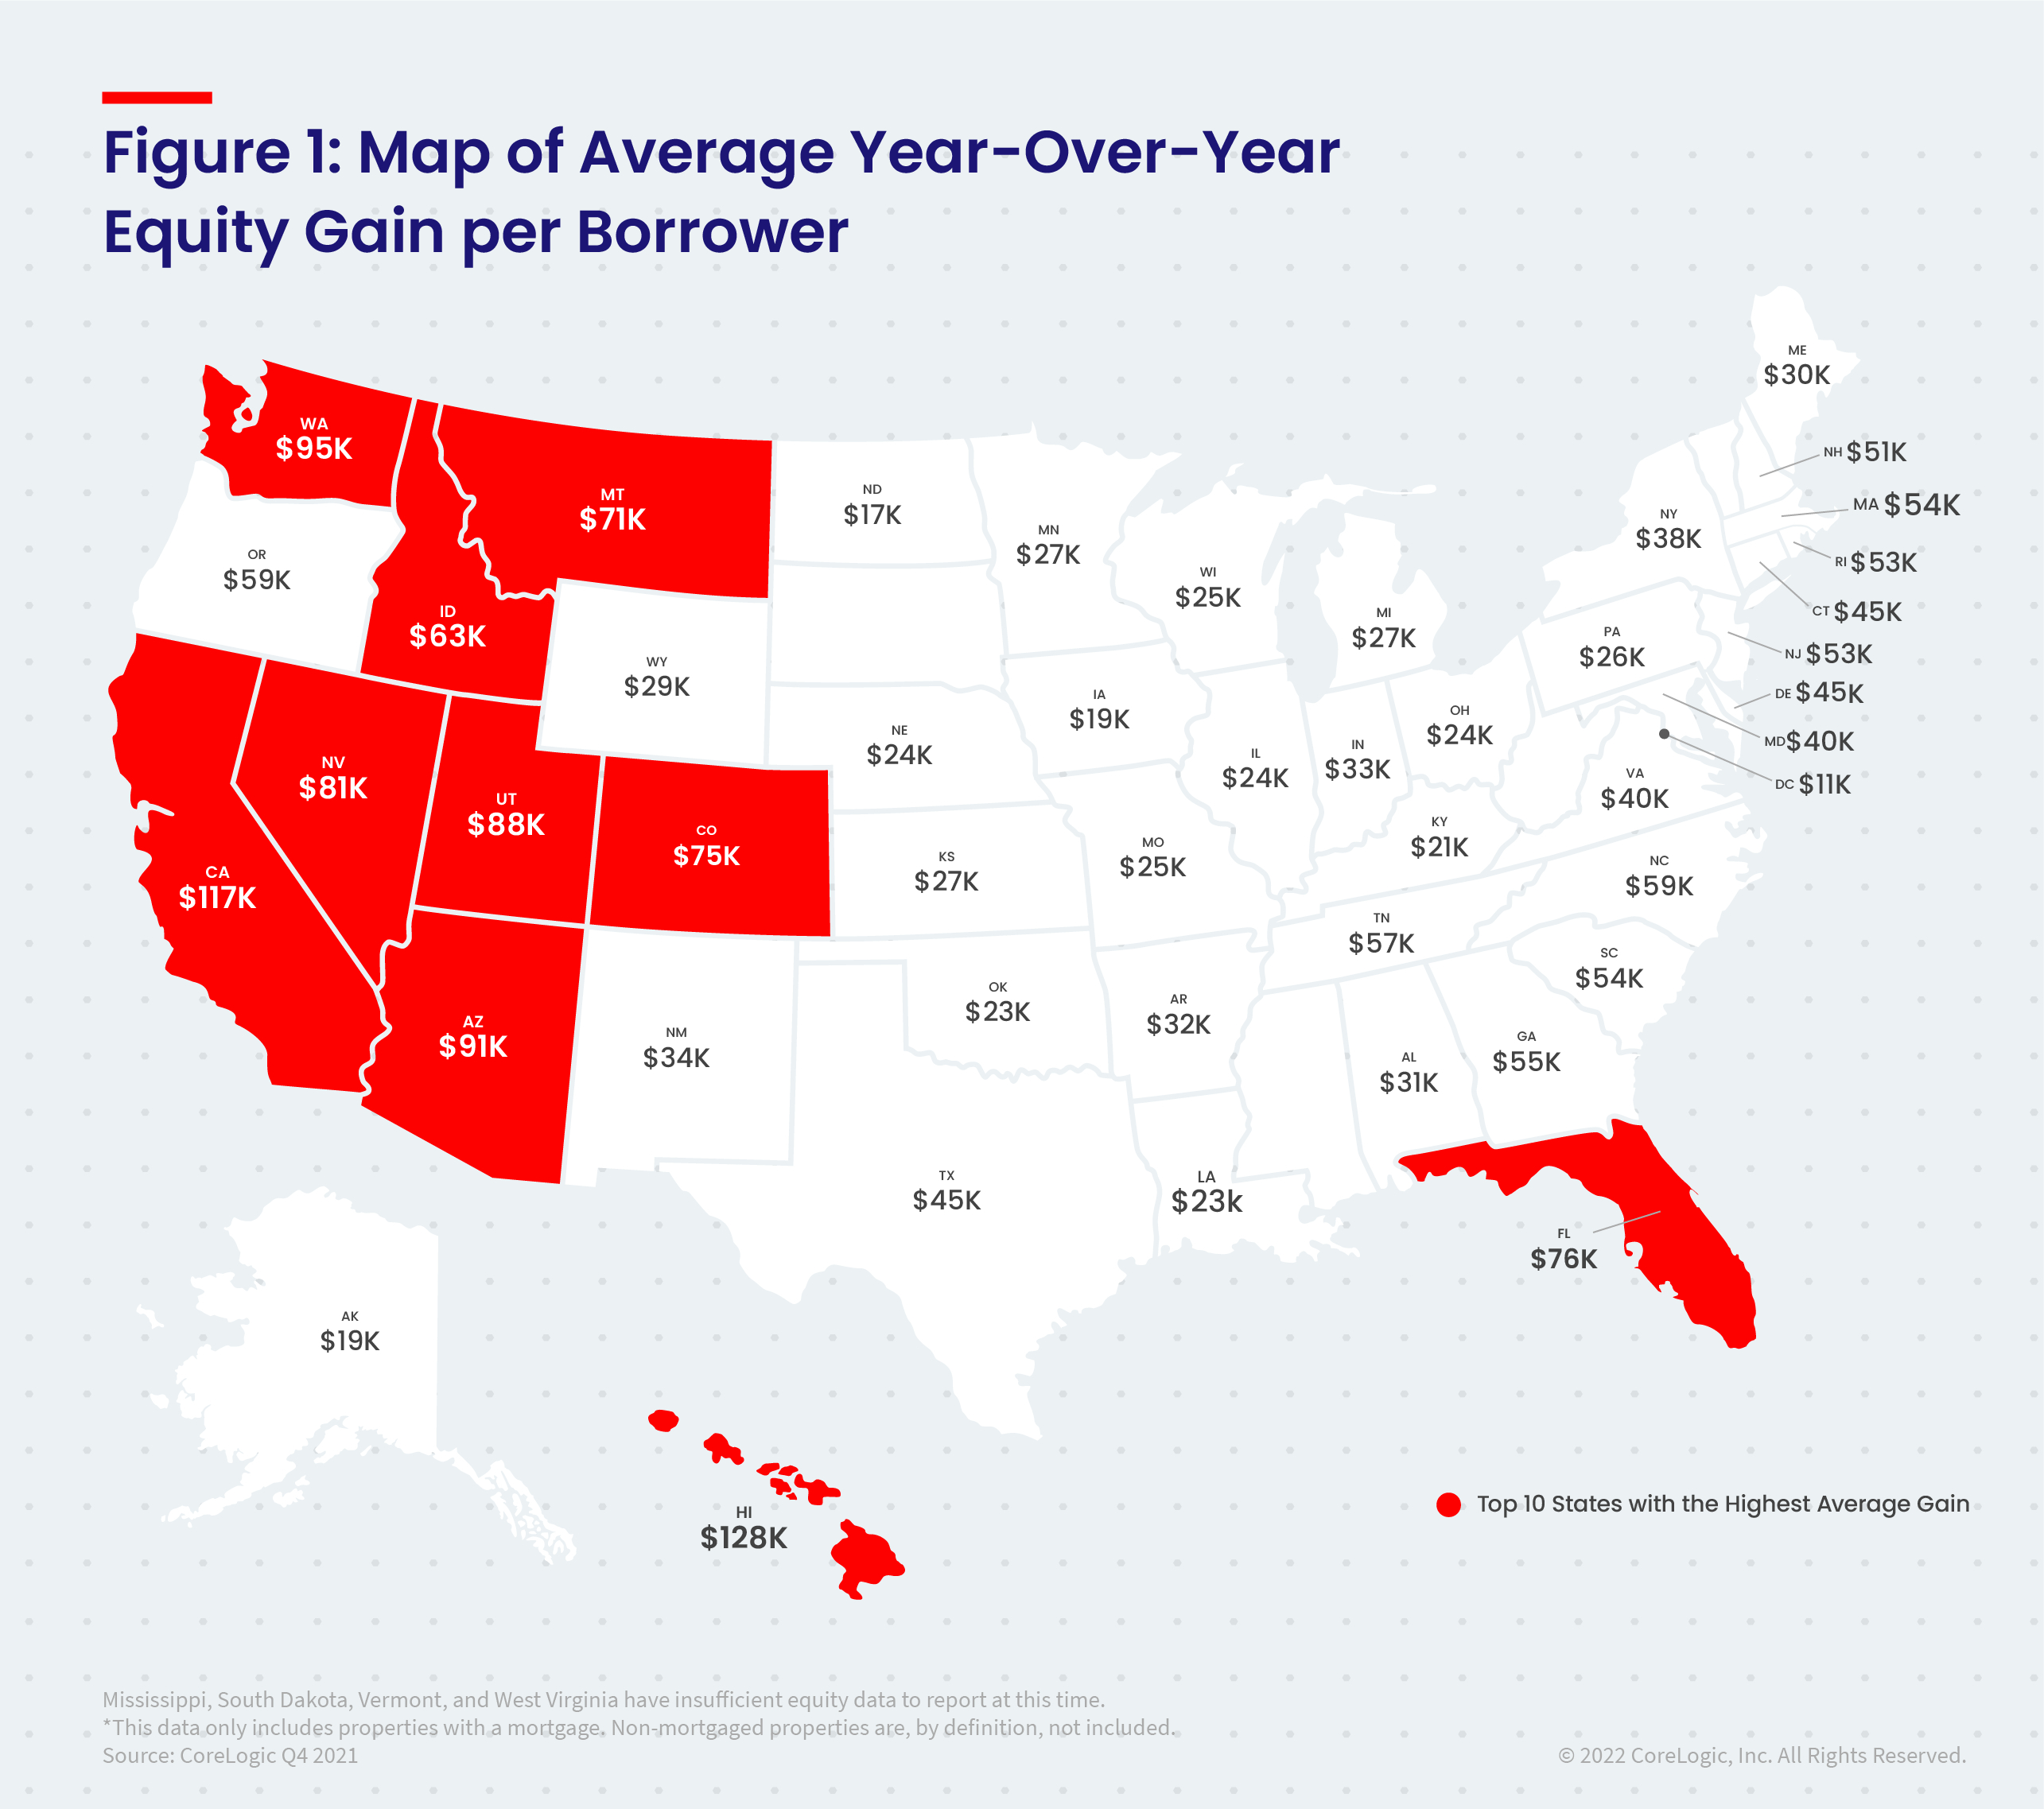
IRVINE, Calif.–(BUSINESS WIRE)–#Foreclosure–CoreLogic, a leading global property information, analytics and data-enabled solutions provider, today released the Homeowner Equity Report for the fourth quarter of 2021. The report shows U.S. homeowners with mortgages (which account for roughly 63% of all properties) have seen their equity increase by 29.3% year over year, representing a collective equity gain of over $3.2 trillion, and an average gain of $55,300 per borrower, since the fourth quarter of 2020.
![]()
U.S. home prices rose 18% year over year in the fourth quarter of 2021, up from the 8% annual gain recorded in the fourth quarter of 2020. The appreciation helped push the national negative equity figure to the lowest in over a dozen years, with just 1.1 million homeowners underwater on their mortgages. Western state homeowners saw the biggest equity gains by dollar value, led by Hawaii, California and Washington. Year-over-year price appreciation increased by 19.1% in January 2022 according to CoreLogic’s latest Home Price Index, though growth is projected to eventually slow over the next 12 months.
“Home prices rose 18% during 2021 in the CoreLogic Home Price Index, the largest annual gain recorded in its 45-year history, generating a big increase in home equity wealth,” said Dr. Frank Nothaft, chief economist for CoreLogic. “For low- and moderate-income homeowners, home equity has historically been a major source of wealth.”
Negative equity, also referred to as underwater or upside-down mortgages, applies to borrowers who owe more on their mortgages than their homes are currently worth. As of the fourth quarter of 2021, negative equity share, and the quarter-over-quarter and year-over-year changes, were as follows:
- Quarterly change: From the third quarter of 2021 to the fourth quarter of 2021, the total number of mortgaged homes in negative equity decreased by 3% to 1.1 million homes, or 2.1% of all mortgaged properties.
- Annual change: In the fourth quarter of 2020, 1.5 million homes, or 2.8% of all mortgaged properties, were in negative equity. This number decreased by 24.9%, or approximately 380,000 properties, by the fourth quarter of 2021.
- Distribution of negative equity: Of loans in negative equity in the fourth quarter of 2021, 42% had a loan-to-value ratio below 125%, and 58% had a loan-to-value ratio of 125% or higher.
Because home equity is affected by home price changes, borrowers with equity positions near (+/- 5%) the negative equity cutoff are most likely to move out of or into negative equity as prices change, respectively. Looking at the fourth quarter of 2021 book of mortgages, if home prices increase by 5%, 141,000 homes would regain equity; if home prices decline by 5%, 183,000 would fall underwater. The CoreLogic HPI Forecast™ projects home prices will increase 5% from December 2021 to December 2022.
The next CoreLogic Homeowner Equity Report will be released in June 2022, featuring data for Q1 2022. For ongoing housing trends and data, visit the CoreLogic Intelligence Blog: www.corelogic.com/intelligence.
Methodology
The amount of equity for each property is determined by comparing the estimated current value of the property against the mortgage debt outstanding (MDO). If the MDO is greater than the estimated value, then the property is determined to be in a negative equity position. If the estimated value is greater than the MDO, then the property is determined to be in a positive equity position. The data is first generated at the property level and aggregated to higher levels of geography. CoreLogic uses public record data as the source of the MDO, which includes more than 50 million first- and second-mortgage liens, and is adjusted for amortization and home equity utilization in order to capture the true level of MDO for each property. Only data for mortgaged residential properties that have a current estimated value are included. There are several states or jurisdictions where the public record, current value or mortgage data coverage is thin and have been excluded from the analysis. These instances account for fewer than 5% of the total U.S. population. The percentage of homeowners with a mortgage is from the 2019 American Community Survey. Data for the previous quarter was revised. Revisions with public records data are standard, and to ensure accuracy, CoreLogic incorporates the newly released public data to provide updated results.
CoreLogic HPI Forecasts™ are based on a two-stage, error-correction econometric model that combines the equilibrium home price—as a function of real disposable income per capita—with short-run fluctuations caused by market momentum, mean-reversion, and exogenous economic shocks like changes in the unemployment rate. With a 30-year forecast horizon, CoreLogic HPI Forecasts project CoreLogic HPI levels for two tiers — “Single-Family Combined” (both attached and detached) and “Single-Family Combined Excluding Distressed Sales.” As a companion to the CoreLogic HPI Forecasts, Stress-Testing Scenarios align with Comprehensive Capital Analysis and Review (CCAR) national scenarios to project five years of home prices under baseline, adverse and severely adverse scenarios at state, metropolitan areas and ZIP Code levels. The forecast accuracy represents a 95% statistical confidence interval with a +/- 2% margin of error for the index.
Source: CoreLogic
The data provided is for use only by the primary recipient or the primary recipient’s publication or broadcast. This data may not be re-sold, republished or licensed to any other source, including publications and sources owned by the primary recipient’s parent company without prior written permission from CoreLogic. Any CoreLogic data used for publication or broadcast, in whole or in part, must be sourced as coming from CoreLogic, a data and analytics company. For use with broadcast or web content, the citation must directly accompany first reference of the data. If the data is illustrated with maps, charts, graphs or other visual elements, the CoreLogic logo must be included on screen or website. For questions, analysis or interpretation of the data, contact Robin Wachner at newsmedia@corelogic.com. Data provided may not be modified without the prior written permission of CoreLogic. Do not use the data in any unlawful manner. This data is compiled from public records, contributory databases and proprietary analytics, and its accuracy is dependent upon these sources.
About CoreLogic
CoreLogic is a leading global property information, analytics and data-enabled solutions provider. The company’s combined data from public, contributory and proprietary sources includes over 4.5 billion records spanning more than 50 years, providing detailed coverage of property, mortgages and other encumbrances, consumer credit, tenancy, location, hazard risk and related performance information. The markets CoreLogic serves include real estate and mortgage finance, insurance, capital markets, and the public sector. CoreLogic delivers value to clients through unique data, analytics, workflow technology, advisory and managed services. Clients rely on CoreLogic to help identify and manage growth opportunities, improve performance and mitigate risk. Headquartered in Irvine, Calif., CoreLogic operates in North America, Western Europe and Asia Pacific. For more information, please visit www.corelogic.com.
CORELOGIC and the CoreLogic logo are trademarks of CoreLogic, Inc. and/or its subsidiaries. All other trademarks are the property of their respective owners.
Contacts
Media Contact:
Robin Wachner
newsmedia@corelogic.com